
How to Measure Innovation ROI: The Enterprise Leader's Guide
Who this post is for: Chief Innovation Officers, VPs of Innovation, Heads of Technology Scouting, and senior innovation program leaders at large enterprises who are accountable for demonstrating portfolio-level strategic value to boards, executive committees, and investment committees — not just justifying a team budget.
Most innovation ROI frameworks were designed for the wrong conversation.
They answer the question "how do I justify my program's budget to my manager" — which is a useful question but not the hardest one. The hardest question is the one that comes after the program has been running for two or three years, the executive sponsor has changed, and the new CFO wants to understand what the organization's innovation investment has actually produced at a portfolio level.
That question requires a different answer. Not a list of activities — evaluations completed, pilots launched, challenge programs run. An evidence base that connects the program's work to specific business outcomes, demonstrates the strategic intelligence value of the portfolio, and shows that the organization is in a better competitive position because the innovation program existed.
Building that evidence base is not something you do in the month before a board presentation. It is something you design into the program's operating model from the beginning — or retrofit as quickly as possible once you realize it is missing.
This post covers how to do it.
The Definition
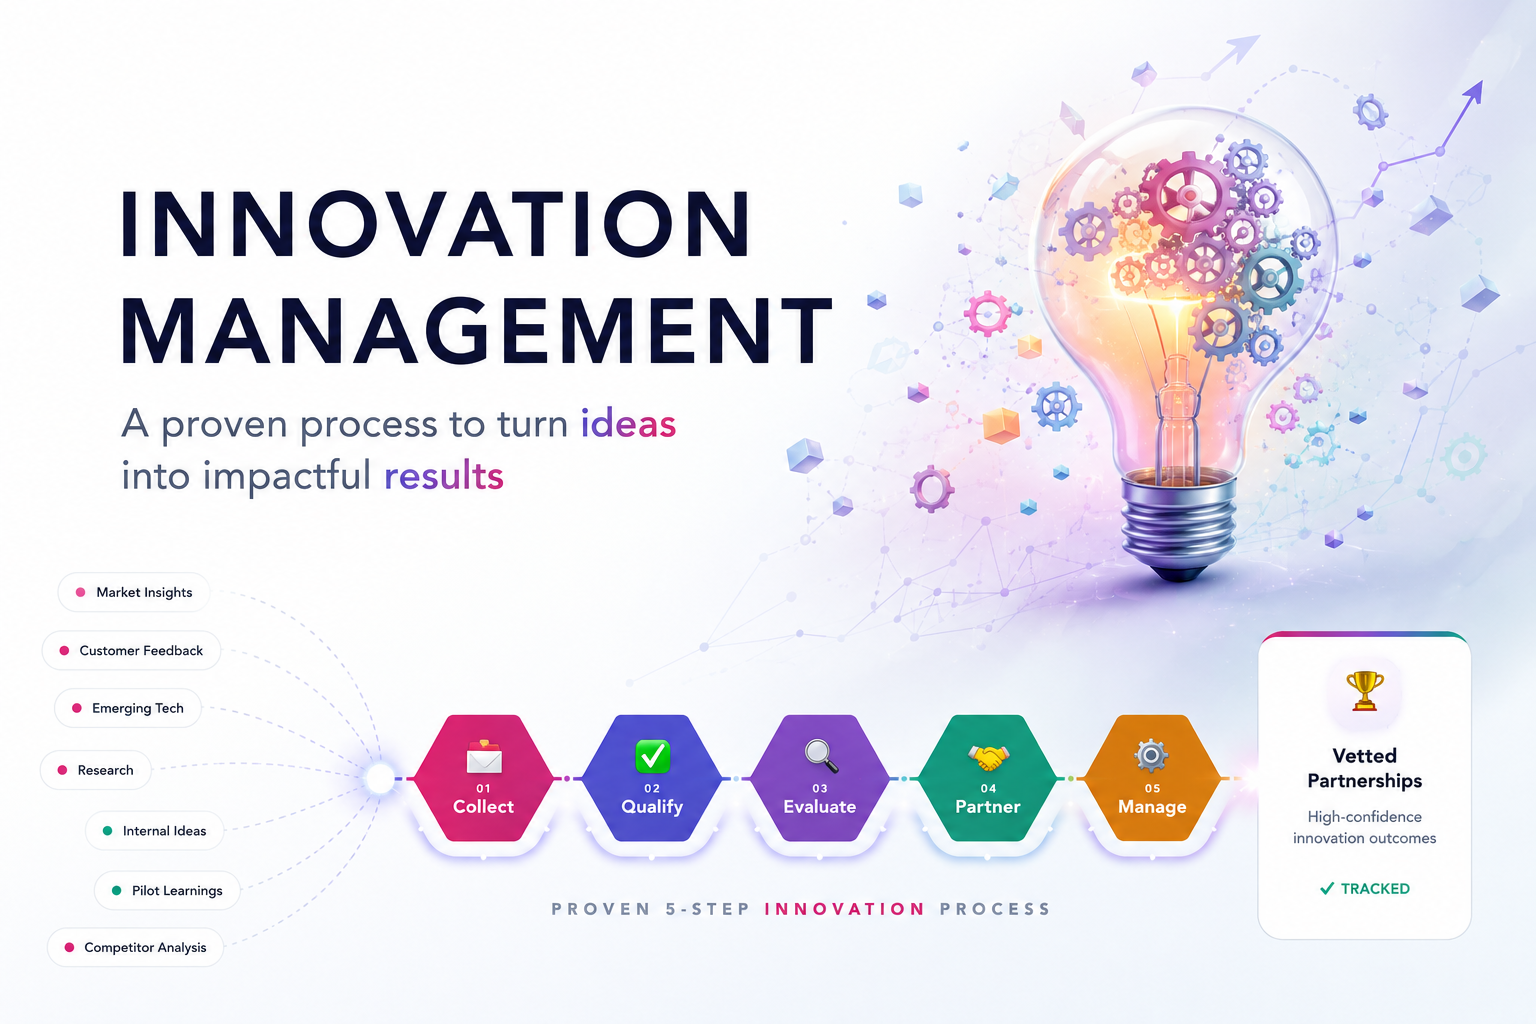
Measuring innovation ROI at the enterprise level is the practice of connecting the innovation program's portfolio of activity — technology evaluations, open innovation challenges, pilot programs, and strategic intelligence outputs — to specific, documented business outcomes that demonstrate strategic value to board-level and executive-committee-level stakeholders in terms they recognize and can act on.
The phrase terms they recognize is the operative one. A board does not recognize "evaluations completed" as a business outcome. It recognizes cost savings realized, revenue contributed, competitive risks identified and avoided, and strategic optionality created. The measurement framework has to connect the program's work to those outcomes — not just count the work itself.
Why Enterprise Innovation ROI Is Harder to Measure Than It Appears
The conventional explanation for why innovation ROI is hard to measure is that innovation value is inherently long-horizon and probabilistic — that the benefit of a technology pilot launched today may not be realized for two or three years, and that connecting the program's work to specific business outcomes requires a causal chain that is difficult to document.
This is true. It is also not the primary reason most enterprise innovation programs cannot answer the ROI question clearly.
The primary reason is structural: most innovation programs were not designed to capture the data required to demonstrate ROI. The evaluation rationale that would justify a vendor selection is not documented. The pilot success criteria that would connect a deployment decision to a business outcome were not defined in advance. The strategic intelligence the program produced — the competitive risks identified, the market movements anticipated, the technology categories monitored — was never captured as a structured, auditable record.
The measurement problem is almost always a data capture problem. You cannot demonstrate what you did not document. And documentation that happens retroactively — assembled under pressure before a board presentation — is not credible. It is reconstruction, and experienced executives know the difference.
The Five Things Boards and Executive Committees Actually Want to Know
Before building the measurement framework, it helps to be precise about what the question actually is. Enterprise leadership is not asking one question when they ask about innovation ROI. They are asking five questions that require five different types of evidence.
Question 1: What business outcomes has the program produced?
This is the financial question. It wants specific, quantified impact: cost savings from a deployed technology, efficiency gains from an operational improvement, revenue contribution from a new capability, risk mitigation from a compliance technology deployment. When the program can answer this question with specific numbers and documented causal chains, the ROI conversation is resolved.
The challenge is that not every program cycle produces deployed technologies with quantifiable near-term impact. Early-stage programs and programs focused on longer-horizon technology categories will have portfolios full of evaluations and pilots that have not yet reached scale decisions. The answer to this question in the first two years of a program is often thinner than the program's actual value — which is why the other four questions matter.
Question 2: What strategic risks has the program helped the organization avoid?
This is the risk management question. It is often the most undervalued ROI category and the most powerful one for programs that have not yet produced deployed technologies.
The vendor evaluated and declined because a critical security gap was identified before procurement commitment — that is risk avoidance value. The technology category monitored continuously that produced early warning of a competitive threat before it became visible through other channels — that is strategic intelligence value. The pilot stopped at the mid-point because the evidence showed it would not meet success criteria — that preserved resources and vendor relationship capital that would otherwise have been consumed in a failing deployment.
Risk avoidance is harder to quantify than cost savings but it is not impossible to document. The evaluation record that shows a vendor was assessed, a critical gap was identified, and a decline decision was made based on that gap — with the estimated cost of the problem that did not happen — is a document that demonstrates the program's governance function working.
Question 3: What strategic optionality has the program created?
This is the forward-looking question. Boards want to know whether the innovation program is giving the organization a first-mover advantage in technology categories that will be competitively important — whether the program is building a pipeline of vetted options that the organization can act on faster than competitors who are starting their evaluation from scratch.
Strategic optionality is demonstrated by a live, current, structured pipeline of evaluated technology candidates in priority categories — showing that when the business need becomes urgent, the organization is not starting from zero. The company that has already evaluated three vendors in a category and has one in advanced pilot discussion is six to twelve months ahead of the competitor who is just starting to build a vendor list.
Question 4: What organizational capability has the program built?
This is the institutional memory question. Boards want to know whether the innovation program is building a durable organizational capability — whether the intelligence and experience accumulated over three years is an asset that will compound — or whether the program is a series of disconnected projects that resets when the team changes.
The answer to this question is only available if the program has been capturing its evaluation history, pilot outcomes, and category intelligence as structured, accessible records in a system the organization owns. A program that can demonstrate a current, organized, searchable history of evaluations, decisions, and outcomes across multiple years and multiple technology categories is demonstrating organizational capability. A program that cannot — because the history lives in personal files and email archives — is demonstrating dependency on individuals rather than institutional capability.
Question 5: How does the program's investment compare to the alternatives?
This is the opportunity cost question. What would it cost the organization to produce the same strategic intelligence and technology evaluation capability without the program — through external consultants, analyst subscriptions, internal R&D investment, or reactive vendor evaluation when needs become urgent?
This comparison almost always favors a purpose-built program with the right infrastructure. External consultants produce point-in-time intelligence without institutional memory. Analyst subscriptions provide market context without evaluation specificity. Reactive vendor evaluation happens under time pressure with incomplete information and produces worse decisions at higher cost. The innovation program, properly structured and properly measured, is significantly more cost-effective than the alternatives — but only if the comparison is made explicitly rather than left implicit.
The Enterprise Innovation ROI Framework
A measurement framework that answers all five questions requires structured data capture across four dimensions throughout the program's lifecycle — not assembled retrospectively when the board presentation is scheduled.
Dimension 1: Outcome Records — Document Business Impact at Decision
Every evaluation that reaches a decision gate — whether the outcome is scale, stop, or defer — should produce a structured outcome record before moving on. Not a comprehensive report. A structured record with six fields:
Initiative. Which technology category, which scouting priority, which open innovation challenge.
Evaluation summary. What was assessed and what was found — two to three sentences capturing the substance of the evaluation.
Decision. Scale, stop, or defer — with the date.
Business impact documentation. For scale decisions: projected business impact, timeline to realization, business unit owner accountable for the impact. For stop decisions: estimated cost of the problem that was avoided, resource preservation, and learning captured. For defer decisions: the specific condition that would trigger reconsideration.
Strategic fit rationale. How does this decision connect to the strategic priority that originated the evaluation?
Evidence quality. Was the decision made with high-confidence evidence — a completed pilot with measured outcomes — or with moderate-confidence evidence — a structured assessment without pilot validation? This field is important for board-level credibility because it signals epistemic honesty rather than overconfidence.
Six fields. Five to ten minutes per evaluation at closure. This is the data that makes the business outcome answer, the risk avoidance answer, and the opportunity cost answer available when the board asks.
Dimension 2: Portfolio Intelligence Records — Document Strategic Value Continuously
The strategic optionality and organizational capability answers require continuous documentation of what the program's intelligence function is producing — not just at decision points but throughout the monitoring and evaluation lifecycle.
At minimum, maintain three living records:
Category intelligence summaries. For each active scouting priority, a quarterly summary of the current state of the vendor landscape — who the leading candidates are, what the competitive dynamics look like, what significant developments have occurred, and what the program's current recommended posture is. Updated quarterly. Accessible to leadership at any time.
Early warning log. A running record of strategic signals the program identified before they became visible through other channels — competitive moves, technology category developments, vendor consolidations, regulatory changes. Each entry documents what was identified, when, through what mechanism, and what action was taken or recommended.
Pipeline status summary. A current view of the full evaluation pipeline — active evaluations by category and stage, pilots underway with milestone status, decisions pending, and the projected portfolio impact of pilots currently in progress. This is the strategic optionality document — it shows what the organization can act on faster than competitors who have not been building the same pipeline.
Dimension 3: Investment Records — Document Resource Commitment
The opportunity cost comparison requires knowing what the innovation program actually cost to produce its outputs — not just the platform subscription but the full investment including team time, external resources, and supporting subscriptions.
For most enterprise programs, the relevant investment record covers four categories:
Team investment. Hours invested per initiative, tagged to the specific evaluation, pilot, or intelligence function the time served. Not a detailed timesheet — a weekly summary of where program resources were deployed, categorized by initiative type.
External investment. Consultant fees, analyst subscriptions, conference attendance, and other external resources directly supporting the program's work.
Platform investment. The cost of the innovation management platform and any supporting tools.
Opportunity cost. The estimated cost of the decisions that were not made — evaluations that were not conducted, categories that were not monitored — due to capacity constraints. This field makes the case for program investment visible rather than implicit.
Dimension 4: Quarterly Portfolio Summary — Maintain the Board-Level View in Real Time
The most important document an enterprise innovation program produces is not the annual ROI report. It is the quarterly portfolio summary — a consistent, current, structured view of what the program is working on, what it has produced, what it has learned, and what leadership should expect next.
A quarterly portfolio summary for board or executive committee consumption covers:
Portfolio outcomes this quarter. Scale decisions made, stop decisions made with learning documented, pilots initiated, and strategic intelligence produced. Specific, not vague. Connected to business impact, not just activity.
Portfolio status current. Active evaluations by category and stage, pilots underway with milestone status, decisions expected next quarter. The forward view that demonstrates the program has direction rather than just momentum.
Strategic intelligence highlights. Two to three significant developments identified by the program this quarter that have strategic implications for the organization — competitive moves, technology category shifts, vendor consolidations, emerging risks. Each one with a brief summary of the implication and the recommended organizational response.
Investment summary. What the program cost this quarter and what it produced — in a format that supports the opportunity cost comparison if leadership asks for it.
Four sections. One to two pages. Produced quarterly on a fixed cadence rather than assembled on demand when someone asks for it. The consistency is as important as the content — a board that receives a structured quarterly update for eight consecutive quarters has a fundamentally different level of confidence in the program than one that receives ad-hoc reporting when someone asks what the program has been doing.
The Metrics That Matter at Board Level
Most innovation measurement frameworks are built around metrics that matter to the innovation team — evaluation throughput, pipeline velocity, screening accuracy. These are useful for program management but they are not the metrics that answer the board's questions.
Board-level innovation metrics fall into three categories:
Outcome metrics — what changed:
- Technologies deployed — number and projected annual business impact
- Cost savings realized from deployed technologies — documented and auditable
- Revenue contribution from new capabilities enabled by innovation program — attributed and documented
- Operational improvements deployed — with measured efficiency impact
- Competitive risks identified and avoided — with estimated cost of the avoided problem
Strategic intelligence metrics — what the organization now knows:
- Technology categories with current, structured evaluation history — demonstrating organizational capability
- Early warning signals identified before becoming visible through other channels — demonstrating intelligence function value
- Pipeline of vetted technology candidates available for rapid deployment when need becomes urgent — demonstrating strategic optionality
- Categories where prior evaluation work accelerated a current decision — demonstrating institutional memory compounding
Investment efficiency metrics — what it cost to produce these outcomes:
- Cost per scale decision — total program investment divided by number of scale decisions that reached deployment
- Time from scouting priority definition to pilot initiation — demonstrating process efficiency
- Proportion of evaluations that built on prior institutional memory rather than starting from scratch — demonstrating compounding value
- Program cost versus external alternative — consultant fees, analyst subscriptions, and reactive evaluation costs that the program replaced
The Compounding Argument — Why the ROI Case Gets Stronger Every Year
The most powerful argument for enterprise innovation program investment is not the first-year ROI. It is the compounding argument — the demonstration that the program's value increases exponentially over time because the institutional memory it is building makes every future evaluation faster, cheaper, and more accurate.
A program that has been running for three years on a structured platform has accumulated the evaluation history of dozens of vendor assessments, the outcome data from multiple pilots, and the category intelligence from continuous monitoring of priority technology areas. A new evaluation in a category the program has assessed before starts from everything already known — which means it takes a fraction of the time, produces a higher-quality shortlist, and reaches a decision faster than a first-time evaluation in the same category.
This compounding value is invisible if the institutional memory lives in personal files and email archives. It is visible and demonstrable if it lives in a platform that shows the history, surfaces the prior evaluations, and makes the accumulated intelligence accessible in real time.
For board-level presentation, the compounding argument is made most powerfully through a side-by-side comparison: the time and cost of the first evaluation in a technology category versus the time and cost of the fourth evaluation in the same category after three years of institutional memory accumulation. The difference — which is typically significant — is the compounding value made tangible.
What Changes When You Use a Purpose-Built Platform
The measurement framework described above requires structured data capture throughout the program lifecycle — not assembled manually before each quarterly review. Without a platform that captures evaluation records, outcome documentation, portfolio status, and investment data as workflow outputs rather than documentation tasks, the measurement framework is a burden rather than a system.
With Traction:
Outcome records are captured as structured data at every decision gate — searchable, comparable across categories, and connected to the strategic priorities that originated the evaluation.
Portfolio intelligence is current in real time — category pipeline status, pilot milestone tracking, and early warning signals captured as structured records rather than assembled manually before leadership reviews.
Investment tracking is built into the workflow — time invested per initiative is captured as program data rather than requiring a separate time-tracking discipline.
Quarterly portfolio summaries are generated from live structured data rather than assembled from memory and email archives — which means they are both faster to produce and more credible to receive.
Standard seats give innovation managers the full capability of an enterprise innovation function — every feature, every AI workflow, every reporting capability. Unlimited View-Only access gives every board member, executive committee member, and business unit leader who needs visibility into the program access at no additional cost.
The measurement framework is only as credible as the data behind it. A platform that captures the right data continuously is what makes the board-level ROI conversation a presentation of evidence rather than a defense of intuition.
Frequently Asked Questions
How do you measure innovation ROI at the enterprise level?
By capturing structured data across four dimensions throughout the program's lifecycle: outcome records that document business impact at every decision gate, portfolio intelligence records that document strategic value continuously, investment records that document resource commitment by initiative, and quarterly portfolio summaries that maintain the board-level view in real time. The measurement framework has to be designed into the program's operating model from the beginning — not assembled retroactively when the board presentation is scheduled.
What metrics do boards and executive committees use to evaluate innovation programs?
Three categories: outcome metrics that measure what changed — technologies deployed, cost savings realized, revenue contributed, risks avoided; strategic intelligence metrics that measure what the organization now knows — categories with current evaluation history, early warning signals identified, pipeline of vetted candidates available for rapid deployment; and investment efficiency metrics that measure what it cost to produce these outcomes relative to the alternatives.
Why is innovation ROI harder to demonstrate at the enterprise level than for small teams?
The evidence standard is higher. A small team justifying a budget to a manager needs to demonstrate that the program produced value and used resources efficiently. An enterprise leader demonstrating ROI to a board or executive committee needs to demonstrate that the program produced specific, documented business outcomes, created strategic optionality that the organization can act on, built a durable organizational capability that compounds over time, and was more cost-effective than the available alternatives. Each of those claims requires a different type of evidence — which is why the data capture framework has to be more comprehensive.
What is the difference between activity metrics and outcome metrics in innovation programs?
Activity metrics measure what the program did — evaluations completed, pilots launched, challenges run, vendors screened. Outcome metrics measure what changed as a result — technologies deployed, costs reduced, risks avoided, strategic decisions informed by program intelligence. Boards respond to outcome metrics. Programs that present activity metrics in response to an ROI question are answering the wrong question — even if the activity numbers are impressive.
How do you demonstrate strategic optionality as an innovation ROI metric?
Through a current, structured pipeline of evaluated technology candidates in priority categories — showing that when a business need becomes urgent, the organization can act faster than competitors who are starting their evaluation from scratch. The pipeline document shows active evaluations by category and stage, pilots underway, and decisions pending. The strategic optionality argument is: the competitor starting their vendor evaluation today will be six to twelve months behind the organization that has already evaluated three vendors in the category and has one in advanced pilot discussion.
What is the compounding argument for enterprise innovation program investment?
The argument that the program's value increases exponentially over time because the institutional memory it builds makes every future evaluation in the same category faster, cheaper, and more accurate. A program running for three years has accumulated evaluation history, pilot outcomes, and category intelligence that makes fourth-cycle evaluations dramatically more efficient than first-cycle evaluations. The compounding value is made tangible by comparing the time and cost of the first evaluation in a category versus the fourth — after three years of accumulated institutional memory.
How do you build the board-level ROI case when the program has not yet produced deployed technologies?
Through three alternative value categories that do not require deployment outcomes: risk avoidance — the estimated cost of problems that did not happen because the evaluation identified critical gaps before commitment; strategic intelligence — the demonstrated value of maintaining a current view of priority technology categories that informed decisions across the business; and strategic optionality — the pipeline of vetted candidates available for rapid deployment when needs become urgent. Together these categories produce a credible ROI case even in a program's early years when deployment outcomes are limited.
How often should an enterprise innovation program report to the board?
Quarterly — on a fixed cadence rather than on demand. A board that receives a structured quarterly portfolio update for eight consecutive quarters has a fundamentally different level of confidence in the program than one that receives ad-hoc reporting when someone asks for it. The consistency of the cadence signals that the program is managed rather than reactive. The structure of the update signals that the program is measured rather than anecdotal.
About the Author
Neal Silverman is the co-founder and CEO of Traction Technology. He spent 15 years as a senior executive at IDG — running multiple business units connecting enterprises with emerging technologies through conferences, councils, data services, and professional consulting practices. That firsthand experience watching how enterprises discover, evaluate, and lose track of emerging technology relationships is the origin story of Traction. He works with innovation teams at Armstrong, Bechtel, Ford, GSK, Kyndryl, Merck, and Suntory. Connect on LinkedIn
Related Reading
- Proving Innovation ROI With a Small Team
- How to Get Leadership Buy-In for Innovation Management Software
- How to Track Innovation Pilots Without a Dedicated Program Manager
- How One Person Can Run an Enterprise-Level Innovation Program
- What Is an Innovation Management Framework? A Practical Guide for Enterprise Teams
- Best Innovation Management Software for Enterprise Teams: 2026 Buyer's Guide
- What Is Innovation Management? A Practical Definition for Enterprise Teams
About Traction Technology
Traction Technology is an AI-powered innovation management software platform trusted by Fortune 500 enterprise innovation teams including Armstrong, Bechtel, Ford, GSK, Kyndryl, Merck, and Suntory. Built on Claude (Anthropic) and AWS Bedrock with a RAG architecture, Traction manages the full innovation lifecycle — from technology scouting and open innovation through idea management, RFI management, and pilot management — with AI-generated Trend Reports, AI Company Snapshots, duplication detection, and decision coaching built in.
One annual subscription at $4,000 gives you the full capabilities of an enterprise innovation team — every module, every AI capability, and unlimited View-Only access for every stakeholder at no additional cost. No setup fee. No data migration charges. Featured in the Gartner Market Guide for AI-Enabled Innovation Management Platforms, February 2026. SOC 2 Type II certified.
Try Traction AI Free · View Pricing · Schedule a Demo · tractiontechnology.com


.webp)